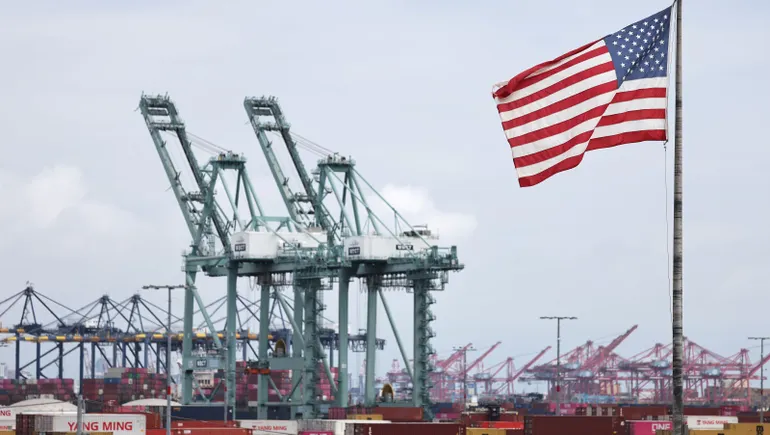
U.S. CONTAINER IMPORTS PLUNGE 6.6% IN SEPTEMBER AS TARIFF FALLOUT TAKES HOLD
The ten largest U.S. ports recorded a 6.6% year-over-year decrease in inbound container volume in September, marking a sharp reversal from earlier months and signaling the beginning of what industry...
The ten largest U.S. ports recorded a 6.6% year-over-year decrease in inbound container volume in September, marking a sharp reversal from earlier months and signaling the beginning of what industry analyst John McCown predicts will be “consistent and more pronounced” declines through 2026.
The September drop follows modest increases of 0.2% in August and 3.2% in July, both periods that McCown says were “significantly buoyed by frontloading to get goods in prior to additional tariffs going into effect.”Prior to those temporary gains, ports saw decreases of 8.3% in June and 6.6% in May.
McCown warns that “inbound volume into the U.S. will show consistent and more pronounced year over year declines well into next year in the absence of any changes to the current tariffs.”
The revised reciprocal tariffs that took effect on August 7 included a critical exception for goods already in transit, which temporarily cushioned the blow. “The new tariffs did not apply to containers that were loaded on vessels at their last foreign port of call before August 7, provided they entered the U.S. before October 5,” McCown explains.This grace period meant most August arrivals and some September shipments, particularly on long Asia-to-East Coast routes, avoided the new levies.
Supply Chain Restructuring Accelerates
McCown observes that adjustments to global supply chains are happening faster than anticipated. “If a manufacturing site wasn’t deemed attractive because it had 10% higher costs, it now looks attractive if it can save 25% tariffs,” he notes. McCown adds that manufacturers in countries facing high U.S. tariffs “may now find other markets without tariffs relatively more attractive.”
This shift is already evident in global data. While U.S. container volume declines, worldwide container volume set records for two consecutive months through August.Container exports from the Far East in August were up 4.6% year-over-year, with “container imports to Africa, Mideast/India and Europe have all increased sharply and in uptrends while U.S. volume is languishing and declining,” according to McCown.
Steep Declines Projected
The full-year outlook represents a dramatic reversal from 2024, which saw a 15.2% increase in total inbound loads compared to 2023.The National Retail Federation now estimates that 2025 will end with total inbound container volume down 3.4% from 2024, which translates to the final four months of 2025 declining 15.7% compared to the same period in 2024.
McCown believes this estimate is reasonable, noting that “we will soon begin to consistently see double-digit percentage drops at most U.S. ports in the months ahead.”He adds that “the volume carnage does not cease at the end of 2025 and will continue into 2026.”
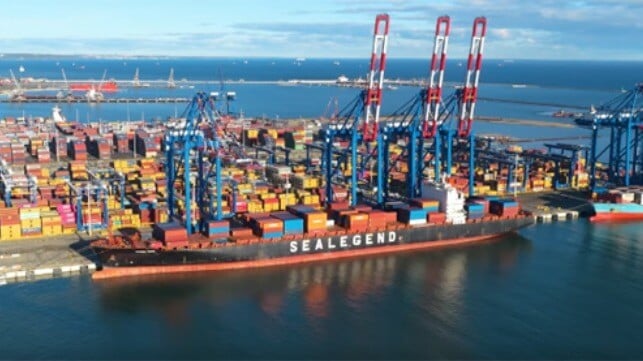
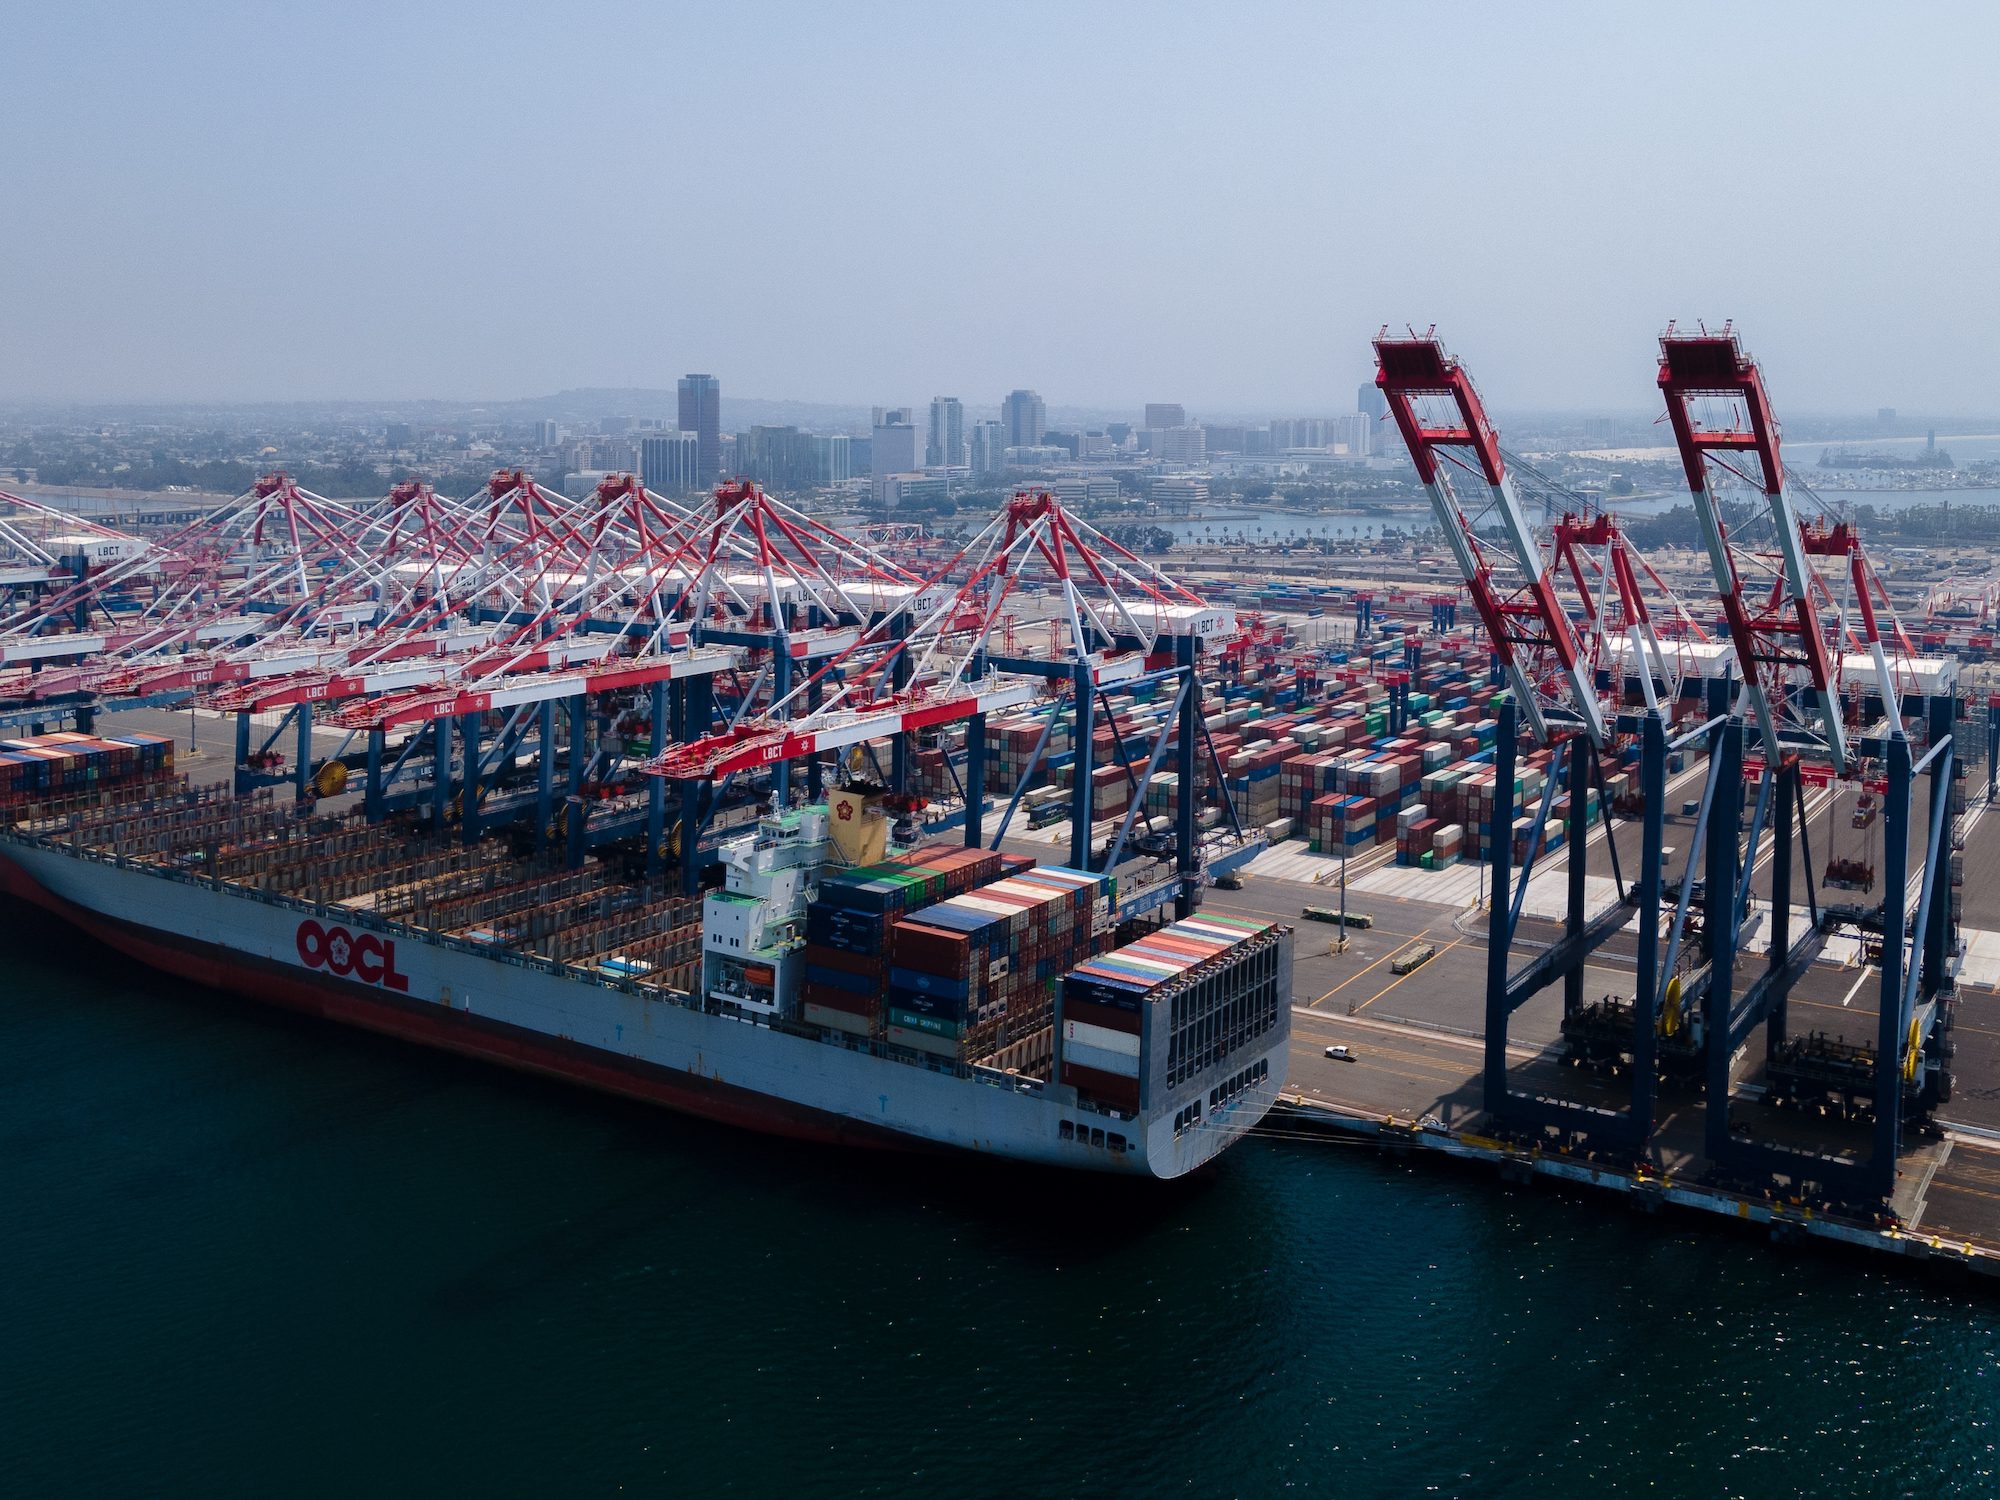
The Port of Los Angeles saw inbound volume decrease 7.6% in September, slightly better than the 10% decline its director had projected.CTS data for August imports to North America showed a 9.9% decline, further confirming the downward trajectory.
China Tariffs and USTR Ship Fees Add Complexity
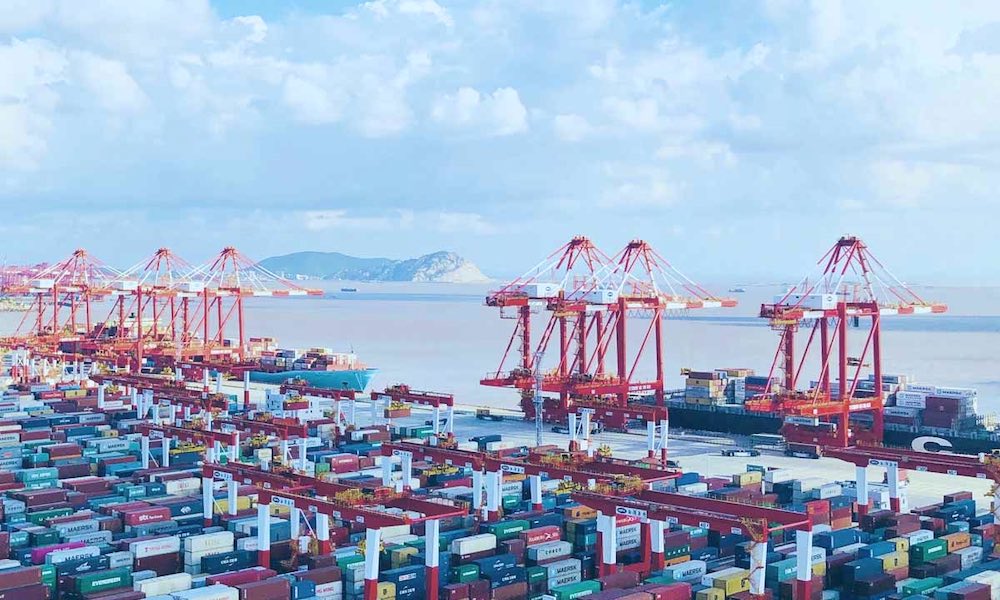
The current declines are occurring even though reciprocal tariffs on China remain paused until mid-November. President Trump recently threatened to impose an additional 100% tariff on Chinese imports, suggesting “there has been little progress in discussions with that large trading partner.” China accounts for the largest share of containers entering the U.S., meaning any additional tariffs there would have significant ripple effects.
The USTR ship fee plan targeting vessels built in China or operated by Chinese carriers took effect on October 14. China announced similar fees for U.S.-affiliated ships calling on Chinese ports in retaliation. While few U.S.-built ships will be directly affected, uncertainty remains over how a provision regarding 25% U.S. ownership will be interpreted, which “under that interpretation, the impact would be quite significant.”
The complexity of overlapping tariffs has created operational chaos. “The sheer number and complexity of the tariffs is a growing problem,” McCown observes, with potential effects on “the fluidity at container terminals and within individual supply chains.”
Mike Schuler